Tuesday, February 9, 2010

2/9/2010 Big Gap after 20-day Low Close

This morning ES opened about 10 points higher than yesterday's RTH close. Historically, there is an edge on the long side when market gaps up after weakness. I use the following criteria to find days similar to this morning:
  1. Gap bigger than 0.75%.
  2. The prior day being lowest close of 20-days.
Since 2002, there have been 30 such instances and 63.33% closed higher for the day with an average of 0.46%. The gap is filled 60% of the time. My generalization is that market tends to re-test the low and fill the gap early in the day and went on close higher later in the day.

When I further add a filter of the previous day's closing price higher than SMA200. The number of instances drops to 2 and both closed positive for the day.

Thursday, February 4, 2010

2/4 Unfilled Large Gap with High Volume making 20-day Low

Whew....what a day. ES was already down six point before the Jobs number was released and the worse than expect job number caused ES to trended down pretty much all day long.

Looking at daily SPY historical data from 2002, there are 27 instances that gap down more than 0.7% and not filled on the same day. The next day has an average of -0.04%. However, the average is rather deceiving, 7 out of the next day close higher for more than 1% and 4 out 27 closed down more than -1%. Out of the 4 instances, 10/6/2008 closed down more than -6% and 11/19/2008 closed down more than -5%. The chance of the next day develops into a trend day is definitely higher than normal, and I would be very cautious the next day.

Interestingly, this kind of behavior seems happen more frequent in sever market drop more than anything other period. 12 out of 27 instances took place after June 2008.

2/3/2010 Consolidation After Two Higher Closes

The most salient feature of today's market is that SPY consolidated after two days of higher closes. I did a search on the historical data of SPY since 2000 to see the historical tendency of the day after. By using the rules of 2 higher highs, followed by a small negative drop, and above SMA200, I found 18 instances. 60% closed higher from the open of the next day and with an average of 0.11%. There is no obvious edge on either side, but I will align myself with the long side and will be looking for entering long position at favorable location.

With the market trading 6 point below yesterday's cash close forming a potential gap at 6:32 AM, I looked into the historical data and found that when market gaps down, the historically tendency does even better, an average of 0.23% vs 0.3% when market opens above yesterday.

Tuesday, February 2, 2010

50-Day High to 50-Day Low and Inside Day

After seeing "From A 50-Day High To A 50-Day Low In 8 Days" post on "Quantifiable Edges", I decided to run my own testing seeing what happens after SPY move from 50-day high to 50-day low in less than 8 days.

Since 2002, I found 4 such instances on 3/10/2004, 5/16/2006, 2/26/2007, and 7/25/2007. Regardless of number of days out, decent size drop occurred after all 4 instances with and average of -1.76%, -1.63%, -2.30%, -1.42% and -1.22% for 1, 3, 5, 10, and 20 days out.

Interesting inside days seems to occur soon after such quick drop, which also took place on 2/1/2010 after a move from 50-day high to 50-day low within 8 days. This finding somewhat give support to my hypothesis that the market is in the consolidation phase. The weakness may continue, but I do not expect severe drop to follow unless there is some sort of catalyst.

Monday, February 1, 2010

A Day of Consolidation

Today (2/1/2010) ends up being another inside day. This is the second inside day within two weeks with the last one being 1/25/2010. Historically when SPY is trade below 50-day moving average but above 200-day moving average, it seems that frequent inside days signals a some sort of bottoming process and high possibility of market retracing the losses within 20 days.

I sound very uncertain because, inside day does not seem to help much on timing the rally.All I can be certain is that imminent farther sever drop does not seem likely under current condition according to historical data.

Another phenomenon I observed is that when the inside day is made on volume lighter than 20-day average, the chance of next day close higher is 60% vs. 33%, and average return of 0.15% vs. -0.07% (n=16 vs. n=15). This could be purely random, but interesting nonetheless. Today's volume happens to less than 20-day average.

So how does this information help intra-day trading? I am more incline to go long at lower extremes rather than fading breakouts, and I will tend to take profit a little bit early when fading breakouts.

Stats on Market Profile Normal Day


According to the definition in Jim Dalton's book "Mind Over Market", the main character of Normal Day is its wide Initial Balance not upset during the day and it is more of an exception rather than normal.

After this morning's somewhat slow trading, I decided to spend some time doing some counting on Normal Day, and here is what I have found:

Since 9/7/2005, there have only been 20 trading days that has the characteristics of Normal Day outside of holiday. It is indeed a exception rather than the norm to have market traded within the IB outiside of holiday.

Another interesting observation I found is that Normal Day is generally caused by lack of participation rather than strong directional conviction. Outside if IB, the volume of each 30-minute period is -36% less than 20-day average of the same 30-minute period. The two 30-minute periods that make up IB has 7% more volume than 20-day average.

From the daily data, I doubt Normal Day has any much significance. I can't find any strategy to trade Normal Day to produce profit better than a coin flip.

Saturday, January 30, 2010

Consecutive 20-day Lowest Close

Yesterday close lower than yesterday and extend the streak of 20-day lowest close to two and the streak of consecutive 20-day lowest low to 4.

Let's first see what happen after 2 consecutive days making 20-day lowest close. To find situation similar to today, I specified the following additional condition:
  1. Both volume higher than 20-day average.
  2. Volatility higher than 20-day average.
  3. Above 200-day SMA.
Since 2002, there have been only seven such instances and all have occurred between 2004 and 2007. Within the next five days, all instances moved higher than the open of the next day. Even though the size of sample is really small, I would be very cautios with any farther short postion in next few days.

Thursday, January 28, 2010

Outside Day on 20-Day Low

The historical tendency played out nicely today. SPY made 20-day low on expanded volatility forming a outside day. I did a quick check on the historical stats on 20-day low made by outside day.

Since 2002, there have been 19 such instances. 15 instances close higher with an average of 0.70% and 4 instance close lower for average -1.34%.

My interpretation is that market has high tendency to consolidate, but if it does not, weakness ensues.

Wednesday, January 27, 2010

Stats on Fed Day

Dr. Steenbarger's blog is one of my daily must reads. In the article "How Do Federal Reserve Announcements Affect The Markets?", Dr. Steenbarger wrote that the volatility of the FED day has been exaggerated. The article was written near the end of 2006, I decided to do a quick check to see if the quality has changed.

Since 2004, there have been 48 FOMC announcement. 38 out of 48 has volume higher than the 20-day average. In average, SPY volume on FED day is 12% higher than the 20-day average.

29 out of 48 FED days have high low range greater than 20-day average. The SPY range is roughly 0.33 higher which is slightly more than two S&P points.

The quality Dr. Steenbarger described still holds true three years after writing the article. The most interesting thing I found in my research is that 29 out of 48 FED days close positive for the day. Five days later only 8 out of 29 days remain higher than the next open of the day following the FED day. Conversely, 18 closed lower on FED day and 7 out of 18 remain lower than the open of the next day. The sample is pretty low, but my interpretation is that the market tends to over extend itself on the FED day and also on the open of the following day reversion steeper than usual.

If the scenario plays out, I probably would want to align myself accordingly.

Inside Day followed by Outside Day


What's peculiar about last few days is steep drop followed by an inside day then an outside day in a midst of longer term rally. I did a simple test to see what would happen in days after such condition by specify the following condition:
  1. Inside day followed by outside day.
  2. Price is lower than five days ago.
  3. Higher than 200 day simple moving average.
There have been 19 such instances since 2002. The result is overwhelmingly bearish in the next day but three and more days out, market becomes quiet positive. It would be interesting to see how this pattern plays out with the positive bias going into the FED day.

Tuesday, January 26, 2010

20 Day Low vs. Close Higher/Lower for the Day


When I first started learning swing trading, one of the fist thing learned is to trade breakout and follow the trend. I learned specifically to short SPY when it makes 20-day low and go long when it makes 20-day high As anyone who has done any trading, nothing was this easy. The market does produce big moves more often than normal distribution, but the likelihood of reversion is also higher than normal distribution.

I next ventured into the world of technical analysis, and learned that I should not be following trend. I should fade trends most of the time. Instead of selling 20-day low and buying 20-day high, I should buy when the market makes 20-day low with reversal bar.

In this post I compared the average of 1, 3, 5, 10, and 20 day out after SPY made 20-day low and breaking the group into days that closed higher and days that closed lower. Since 2002, there are 18 instances that SPY closed higher for the day when it makes 20-day low and 178 instances that SPY closed lower for the day on the day of 20-day low.

The chart shows two important points:
  1. In average, SPY performs better when it closed higher for the day when making 20-day low.
  2. Regardless how the day closes, SPY has positive expectancy.

However, hiding behind the positive expectancy is that when SPY close higher on the day of 20-day low, 5 and 10 days out about 60% of time SPY actually drops below the low.

Monday, January 25, 2010

Three Consecutive Lower Lows

Photobucket


It's been a while since my last post, I have taken time off blogging to work on compiling historical data and better ways to look for the edge.

Last Friday (1/22/2009) marked the third consecutive days SPY closed lower. Before today's opening, I did a quick check on the historical tendency on the day after three consecutive close. Without any filter, there are 108 instances since 2002 where SPY closed lower three consecutive days. Out 0f 108 instances, 60% of the following day closed higher, but three days out SPY has negative expectancy if going long. My interpretation is that market has high tendency to retrace after three consecutive lower closes, but the bounce is USUALLY not a big rally and market tends to chops and consolidate immediately after three days of consecutive lower close. After 10 days, market tends to retrace all the drops caused by the three days. However, when things goes wrong the floor just drops off. The most recent incidents are 12/19/2008 and 2/2/2009. SPY moved around -9% and -15% respectively 20 days out.

Adding a filter of the last drop being more severe than -1.5%, the picture changes completely. The next day closed lower 56% of the instances with average of -0.36%. The historically edge lies with the short side producing an average of -0.36% and -0.19% for longs. Market also tends to bounce back very strong after such severe drop 5 days out with peak of 2.93% 19 days out.

Tuesday, December 29, 2009

Daily Volatility

ver the flight to Taiwan, I tried looking at the relationship between price and volatility by looking at price, price+1, intraday high minus low, and 20 day moving average of daily volatility using 30 minute intraday data of SPY.

I first check if there’s any follow through on up and down day with daily volatility higher than two standard deviations.

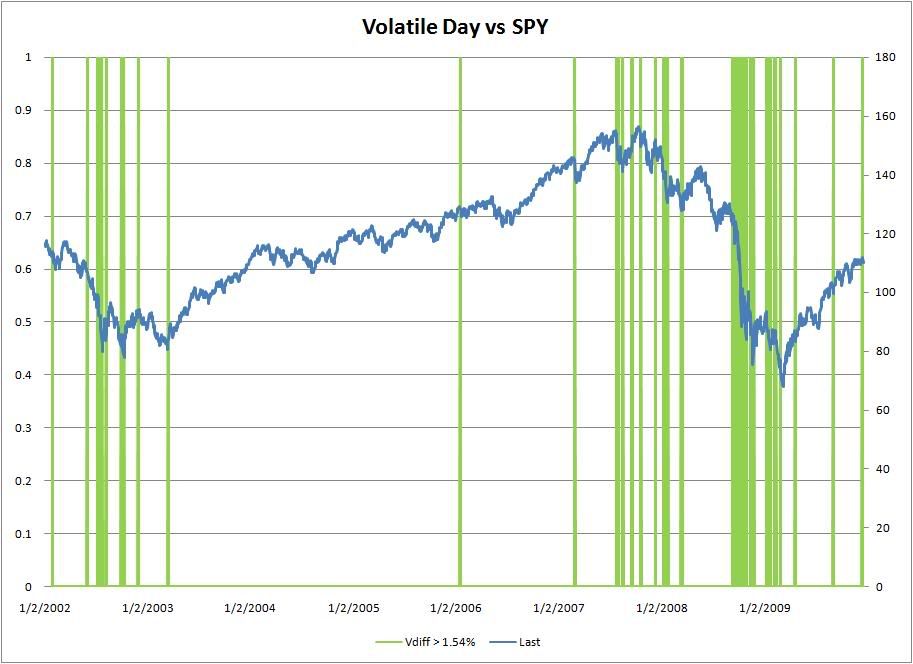
There are 25 instances of up days which have volatility two standard deviation higher than 20 day moving average of volatility (V>V20) out of 2007 days since 2002. Out of 25 instances, 2 instances occurred in January 2007, 5 instances are from July 2002 to October 2002, 12 instances are from September 2008 to February 2009 which coincides with the steepest drop in recent market history. My take on this phenomenon is that once market becomes hectic, the madness will continue for a while. A true longer term bottom will not be put in on a day of huge rally; extreme up days are rare in a market that’s truly going up. On days with high volatility, 52% is followed by up day. The number is really too low to provide any useful information.

The above chart show volatile up days and SPY daily close price plotted on the same chart. From the chart, it is very clear that in recent market history volatile days (even up days) are associated with weak market.


There are 32 instances of down days which have volatility two standard deviations away from the V20 in the negative side. Out of the 32 instances, 2 instances are from July 2002, 6 instances in second half of 2007, and 19 instances are from September 2008 to April 2009. The extreme negative data also supports the hypothesis that days deviate from the volatility means tend to appear near each other. Out of the 32 instances, 56.2% closed higher than the next day. Once again, the number is really too low be of any significance. However, this finding does confirm with earlier hypothesis that extreme weakness tends to be followed by short term bounce rather than more immediate weakness.

I split data into tow group of V20>2%, and V20>1%, but doing so have not yield much useful data so far.

Wednesday, December 23, 2009

Movement after Extreme Strong and Weak Day


In the previous two posts I talked about average movements after 1, 3, 5, and 10 days after extreme strong and weak days separately. Here is a chart comparing the result from the posts.

In the chart, red bars red bars represents average movement after extreme weak days and green bars represent what happen after strong days.

From the chart, it is very clear that market tends to consolidate immediately after extreme strength, attempts follow through, reverse after follow through, and eventually value being accepted.

However, market tends to bounce back immediately after extreme weakness and slowly giving back the retracement after the immediate bounce.

From the historical data, the best time to enter long position is after an extreme weak day. As the chance of immediate bounce on the day after is nearly 60%. How does this information help me? Seeing weakness following an extreme day, I imagine that knowing the historical tendency would help me placing a trade against the immediate trend to secure good location and ride out the bounce.

Relevant posts:
<What Happens To SPY After Extreme Weak Day>
<What Happens To SPY After Extreme Strong Day>

Tuesday, December 22, 2009

What Happens To SPY After Extreme Weak Day

After looking at what happen after a strong day, let's look at what happen after an extreme weak day.

An extreme weak day in this case is defined as a drop more than -2.28%. From 2000, there have been 58 occurrences such drop took place.

  • Next Day: SPY average 0.57%, 24 (41.38%) down, 34 (58.62%) up. Down day with average of -1.74%, and up day with average of 2.20%.

  • 3 Days later: SPY average 0.58%, 26 (44.83%) down, 32 (55.17%) up. Down days with average of -3.16%, and up days with average of 3.62%.

  • 5 Days later: SPY average 0.51%, 28 (48.2%) down, 30 (51.72%) up. Down days with average of -4.1%, and up days with average of 4.82%.

  • 10 Days later: SPY average 0.42%, 26 (44.83%) down, 32 (55.17%) up. Down days with average of -5.5% and up days with average of 5.23%.

From this simple test, it is very clear that farther weakness is not likely to follow extreme weakness even when stretched out to 10 day move. The observation holds true even in the drop lasted from 6/6/2008 to 4/20/2009. The day after extreme drop has average gain of 0.5% in the period, only when zooming out to 5 days or more the down trend is clear.

Monday, December 21, 2009

What Happen To SPY After Extreme Strong Day

從學習交易以來,我一直把 Dr. Steenbarger 當成是模仿的對象,再來這一系列的文章是以 Dr. Steenbarger <Consecutive Narrow Days: What Comes Nex> 這種文章為範本,來探討 SPY ETF 的特性。

利用 1/2/2002 到 12/18/2009 每日歷史資料 N=2007,我們來看看當 S&P 上漲超過 2.28% 後,再來 1, 3, 5, 10 天的表現。會選擇 2.28% 是因為它剛好是 2 standard deviations from absolute value of daily move,在過去七年來這種情形發生了 50 次:

  • Next Day: SPY average -0.01%,20 (40%) down, 29 (58%) up,1 (2%) flat. Down day with average of -1.67, and up day with average of 1.14%.

  • 3 Days later: SPY average 0.46%, 21 (42%) down, 29 (58%) up. Down days with average of -3.31%, and up days with average of 3.19%.

  • 5 Days later: SPY average -0.4%, 27 (54%) down, 23 (46%) up. Down days with average of -4.2%, and up days with average of 4.06%.

  • 10 Days later: SPY average 0.29%, 21 (42%) down, 29 (58%) up. Down days with average of -5.68% and up days with average of 4.27%.
From the first glance, strength seems to have follow through in the immediate three days after the big move, peters out after stretched out to five days, and gaining back strength after ten days.

Sunday, November 29, 2009

Cumulative TICK 的研究

NYSE 指標當中有一個叫做 TICK 的東西,它是 NYSE 股票交易在 uptick 和 downtick 的差別,一搬來講它的值在 1000 到 -1000 中,而 cumulative TICK 則是把一分鐘內 TICK 的高、低、收三個值的平均值加起來的總合。

我採用的資料是 4/30/2007 到 11/20/2009 647 天的一分鐘 TICK 。而這個研究的目的是要看是否能用前十五分鐘 cumulative TICK 來判斷今天是否會成為 trend day。

首先我先算 median,standard deviation (stdev);
  • median = 143, mean = 106
  • stdev = 2882
  • 1 stdev up = 3025, 1 stdev down = -2739
以這個數據我假設說假如 8:45 分 cumulative TICK 在 1 stdev 以上 SPY 收盤的價錢也應該是同樣的方向。

首先我們先來看 TICK 為正數的天數,以下這個 table 可以看的出來 TICK 在過去兩年內,市場是比較偏向於 mean reversion,當 cumulative TICK 超過 1 stdev 但是沒有超過 4000,市場當天上漲的機會比下跌的機會多,但是下跌的幅度比較大。 TICK 必須超過 4000 才勉強算是有 small edge,不過發生的機率實在太低了。


Close Higher

Close Lower

Winning %

Average % Change

Positive Average % Change

Negative Average % Change

Less Than 4000

29

26
52.73%
-0.12%


0.95%


-1.28%

4000 ~ 5000

13

8

61.9%


0.16%

1.01%

-1.34%


5000 ~ 6000

12

7

63.16%


0.47%


1.29%


-0.92%


6000 ~ 7000

7

1

87.5%


1.49%

1.73%-0.22%


7000 ~ 8000

1

0


100%

1.10%
1.10%


0


在來我們看看假如 cumulative TICK 是 1 stdev 往負數的結果。在以下這個表裡,我們可以再次看到市場 reversion to means 的傾向,市場在 cumulative TICK 沒有達到 -4000 的情況下,當天不但上漲的機率較高,上漲的百分比也較多。


Close Higher

Close Lower

Winning %

Average Change %

Positive Average % Change

Negative Average % Change

Greater Than -3000

8

4
33.33%

1.11%1.96%


-0.59%

Neg. 4000 ~ 5000

8

13
61.90%-0.42%


1.20%


-1.41%


Neg. 5000 ~ 6000

5

15

75%


-1.17%2.43%


-2.37%


Neg. 6000 ~ 7000

1

6
85.71%-1.04%


0.9%


-1.37%


Neg. 7000 ~ 8000

0

4


100%
-2.29%
0
-2.64%


依照這次的數據,於是我又發展了兩個簡單的交易規則:
  • Cumulative TICK 在 8:45 AM 之前達到 -4000 或 4000,除非當天有新聞公佈,continuation 可能性較高。
  • Cumulative TICK 若未在 8:45 AM 達到 -4000 或 4000,除非當天有新聞公佈,reversion 可能性較高。

Sunday, November 15, 2009

Advance Decline Line 的一些研究

Advance Decline Line 來判斷是否當天真的會有趨勢。$ADD 基本上告訴你今天上漲股票與下跌股票支的差,假如是 1500 表示今天上漲的股票比下跌的多 1500 支。 詳細的解釋可以在<財金商業科技辭典>找到。

這個週末回顧時看到 Dr. Steenbarger 部落格這篇 <The NYSE Advance-Decline Line: Identifying Trending and Range Environment>,他說的一些數據我覺得還滿值得研究的;

By the end of the first half hour of trade, again going back to October, 2008, we find that the median value for $ADD has been -346, with a whopping standard deviation of 1378. That tells us that, within the first 30 minutes of trading, much of the issue of whether or not we're in a trending environment has been sorted out. (My next post will explore this issue more specifically). If we're seeing $ADD between -1000 and +1000 by the end of the first half hour of trade, we're much less likely to be in a trending environment than if we have readings of +1500 or more or -1500 or less.

Will a break above or below a range lead to a directional, trending move? It's likely that the participation of the NYSE advance-decline line will provide some clues. If, for instance, a break above a market's opening range (say, its range for the first 15 minutes of trade) occurs with $ADD well below +1000 and with mixed sector strength, we might be much less likely to go with that move than if the breakout vaults $ADD above +1500 with strong sector participation and leadership.

也就是說 $ADD 在開盤後半小時幾乎已經成了定局,而判斷是否有突破為真正的突破則可以參考 $ADD 是否超過 1500。我用 2007 年 12/13 到 2009 年 11/13 的數字,出來的數在和史丁巴格博士得數據稍有不同,不過大致上還滿類似的。在我找到的數據裡,開盤時的 median 是 66,standard deviation 是 762,十五分鐘後 median 為 -69,standard deviation 為 1235,半小時後,median 為 -97,standard deviation 為 1217,收盤時 median 為 -3,standard deviation 為 1341。開盤十五分鐘後大局以定。開盤時 ADD 與收盤時 ADD 的 correlation 為 0.53,開盤後十五分鐘 ADD 與收盤時 ADD 的 correlation 為 0.62,

由此可見假如開盤後十五分鐘假如 ADD 超過 1200 或者小於 -1300,表示這一天趨勢還滿強的,必須要注意今天成為 trend day 的可能信還滿高的。從 2007 年十二月到今天只有 37% 的天數是從一開盤就有可能成為 trend day,所以在還未確認前假設今天是 range day,是個正確的假設。

另一個還滿有趣的數據,有 197 天一開盤的 $ADD 是在 1 個 standard deviation 之外 (>882 或者 <-697)。三十分鐘後,還能為在 882 之上或者是 -697 之下的有 82%,但是過了十一點之後只剩 62% 還在這個範圍之外。這樣表示就算一開盤的氣勢很強,但是能維持的只有六成左右,再一次確認假設為 range day 是正確的。最後,一整天都能維持在之前提到的範圍內是所有天數的 25%。 由這個 counting excercise,可以發展出兩個簡單的交易規則:
  • 所有的天數有趨勢的日子不到四分之一,因為我用的趨勢定義已經很低了。
  • 當 $ADD 在開盤後十五分鐘,假如超過 1200 或小於 -1314,今天發展成為趨勢日的機率有四成,比平常高。Fade the market 時要非常小心。


Sunday, November 8, 2009

2X IBH 不同的獲利目標與三點停損


2X IBH 不同的獲利目標與三點停損


InstrumentPerformanceTargetTotal Net ProfitMax. DrawdownSharpe RatioPercent Profitable# of Winning Trades# of Losing Trades
ES 12-102.25763450-120.920.47221719
ES 12-102.22723375-120.930.47221719
ES 12-102.17683225-120.930.47221719
ES 12-102.14843162.5-120.90.47221719
ES 12-102.14883137.5-120.910.47221719
ES 12-102.14523137.5-120.840.47221719
ES 12-102.14923137.5-120.910.47221719
ES 12-102.141003137.5-120.910.47221719
ES 12-102.14963137.5-120.910.47221719
ES 12-102.13803112.5-120.910.47221719
ES 12-102.11643075-120.930.47221719
ES 12-102.1563037.5-120.860.47221719
ES 12-102.06602925-120.920.47221719
ES 12-102.05482887.5-120.830.47221719
ES 12-101.97442687.5-120.830.47221719
ES 12-101.86402387.5-120.80.47221719
ES 12-101.76362087.5-120.740.47221719
ES 12-101.65321787.5-120.670.47221719
ES 12-101.59241537.5-90.660.51818
ES 12-101.54281500-120.580.47221719
ES 12-101.58121137.5-90.420.63892313
ES 12-101.3720962.5-90.450.51818
ES 12-101.2716662.5-90.240.52781917
ES 12-101.228387.5-120.150.66672412

這張表則是今年一月到十月二十七號在 IB x2 的地方放空的結果。從這一張圖再次看到 scale-out 的重要性。獲利的多寡與 scale-out 的比率到15 S&P 點幾乎是成正比 (15 點為 60 ticks),15 點之後則是有點看運氣了。

2X IBL 不同的獲利目標與三點停損


2X IBL 不同的獲利目標與三點停損


InstrumentPerformanceTargetTotal Net ProfitMax. DrawdownSharpe RatioPercent Profitable# of Winning Trades# of Losing Trades
ES 12-101.31148837.5-24.250.10.35711018
ES 12-101.324675-120.240.46431315
ES 12-101.29172775-24.250.10.35711018
ES 12-101.29184775-24.250.10.35711018
ES 12-101.29196775-24.250.10.35711018
ES 12-101.29160775-24.250.10.35711018
ES 12-101.2712487.5-90.270.57141612
ES 12-100.858-262.5-13-0.130.57141612
ES 12-100.8548-412.5-24.25-0.120.35711018
ES 12-100.8344-462.5-24.25-0.130.35711018
ES 12-100.824-212.5-11.25-0.120.7143208
ES 12-100.8140-525-24.5-0.150.35711018
ES 12-100.7736-625-25.5-0.190.35711018
ES 12-100.7332-725-26.5-0.220.35711018

這是在 2x IBL 做多用今年的歷史資料回測的結果,在這個回測中我固定用三點作為停損,來看那一個獲利點的損益最好。從結果中看的到滿有趣的一點,trade manage 在損益上可以造成很到的影響。效益第二好的與最差唯一不同的地方在於獲利點兩點的差別,但是這 S&P 兩點卻造成了將近一口一千六百美金的獲利差別。這個表中也可以看到 scale-out 重要的地方。效益最好的前幾名,分除了 24 這個獲利點外,其他皆是採用超大獲利點為出口。仔細看了一下交易明細,發現造成這個現象的原因是在一月二十一號有一比三十多點的交易。由此可見放長線釣大魚重要的地方。