Dr. Steenbarger's blog is one of my daily must reads. In the article "How Do Federal Reserve Announcements Affect The Markets?", Dr. Steenbarger wrote that the volatility of the FED day has been exaggerated. The article was written near the end of 2006, I decided to do a quick check to see if the quality has changed.
Since 2004, there have been 48 FOMC announcement. 38 out of 48 has volume higher than the 20-day average. In average, SPY volume on FED day is 12% higher than the 20-day average.
29 out of 48 FED days have high low range greater than 20-day average. The SPY range is roughly 0.33 higher which is slightly more than two S&P points.
The quality Dr. Steenbarger described still holds true three years after writing the article. The most interesting thing I found in my research is that 29 out of 48 FED days close positive for the day. Five days later only 8 out of 29 days remain higher than the next open of the day following the FED day. Conversely, 18 closed lower on FED day and 7 out of 18 remain lower than the open of the next day. The sample is pretty low, but my interpretation is that the market tends to over extend itself on the FED day and also on the open of the following day reversion steeper than usual.
If the scenario plays out, I probably would want to align myself accordingly.
Wednesday, January 27, 2010

Inside Day followed by Outside Day

What's peculiar about last few days is steep drop followed by an inside day then an outside day in a midst of longer term rally. I did a simple test to see what would happen in days after such condition by specify the following condition:
- Inside day followed by outside day.
- Price is lower than five days ago.
- Higher than 200 day simple moving average.
Tuesday, January 26, 2010
20 Day Low vs. Close Higher/Lower for the Day

When I first started learning swing trading, one of the fist thing learned is to trade breakout and follow the trend. I learned specifically to short SPY when it makes 20-day low and go long when it makes 20-day high As anyone who has done any trading, nothing was this easy. The market does produce big moves more often than normal distribution, but the likelihood of reversion is also higher than normal distribution.
I next ventured into the world of technical analysis, and learned that I should not be following trend. I should fade trends most of the time. Instead of selling 20-day low and buying 20-day high, I should buy when the market makes 20-day low with reversal bar.
In this post I compared the average of 1, 3, 5, 10, and 20 day out after SPY made 20-day low and breaking the group into days that closed higher and days that closed lower. Since 2002, there are 18 instances that SPY closed higher for the day when it makes 20-day low and 178 instances that SPY closed lower for the day on the day of 20-day low.
The chart shows two important points:
- In average, SPY performs better when it closed higher for the day when making 20-day low.
- Regardless how the day closes, SPY has positive expectancy.
However, hiding behind the positive expectancy is that when SPY close higher on the day of 20-day low, 5 and 10 days out about 60% of time SPY actually drops below the low.
Monday, January 25, 2010
Three Consecutive Lower Lows

It's been a while since my last post, I have taken time off blogging to work on compiling historical data and better ways to look for the edge.
Last Friday (1/22/2009) marked the third consecutive days SPY closed lower. Before today's opening, I did a quick check on the historical tendency on the day after three consecutive close. Without any filter, there are 108 instances since 2002 where SPY closed lower three consecutive days. Out 0f 108 instances, 60% of the following day closed higher, but three days out SPY has negative expectancy if going long. My interpretation is that market has high tendency to retrace after three consecutive lower closes, but the bounce is USUALLY not a big rally and market tends to chops and consolidate immediately after three days of consecutive lower close. After 10 days, market tends to retrace all the drops caused by the three days. However, when things goes wrong the floor just drops off. The most recent incidents are 12/19/2008 and 2/2/2009. SPY moved around -9% and -15% respectively 20 days out.
Adding a filter of the last drop being more severe than -1.5%, the picture changes completely. The next day closed lower 56% of the instances with average of -0.36%. The historically edge lies with the short side producing an average of -0.36% and -0.19% for longs. Market also tends to bounce back very strong after such severe drop 5 days out with peak of 2.93% 19 days out.
Tuesday, December 29, 2009
Daily Volatility
ver the flight to Taiwan, I tried looking at the relationship between price and volatility by looking at price, price+1, intraday high minus low, and 20 day moving average of daily volatility using 30 minute intraday data of SPY.
I first check if there’s any follow through on up and down day with daily volatility higher than two standard deviations.
There are 25 instances of up days which have volatility two standard deviation higher than 20 day moving average of volatility (V>V20) out of 2007 days since 2002. Out of 25 instances, 2 instances occurred in January 2007, 5 instances are from July 2002 to October 2002, 12 instances are from September 2008 to February 2009 which coincides with the steepest drop in recent market history. My take on this phenomenon is that once market becomes hectic, the madness will continue for a while. A true longer term bottom will not be put in on a day of huge rally; extreme up days are rare in a market that’s truly going up. On days with high volatility, 52% is followed by up day. The number is really too low to provide any useful information.
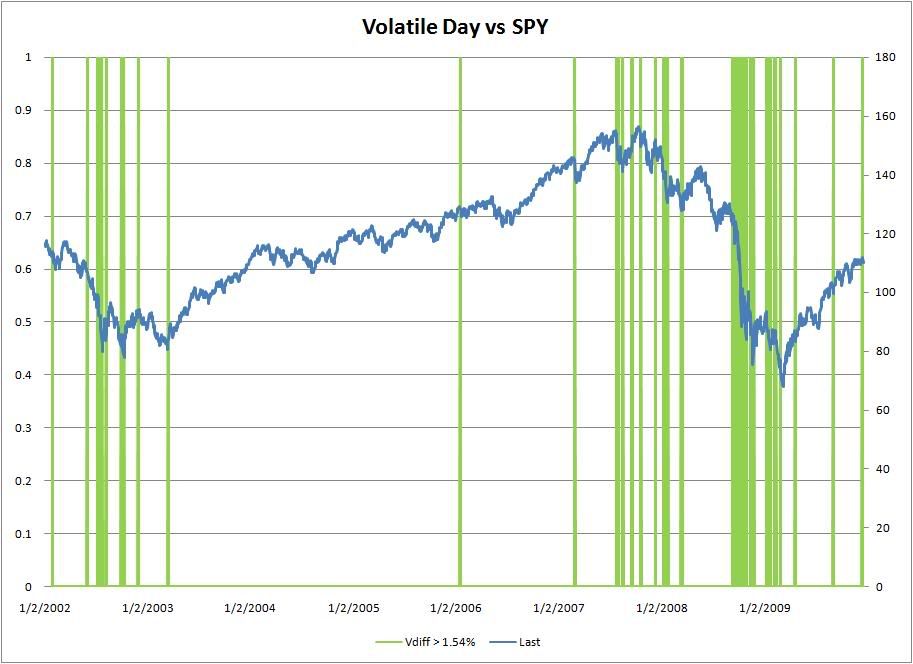
The above chart show volatile up days and SPY daily close price plotted on the same chart. From the chart, it is very clear that in recent market history volatile days (even up days) are associated with weak market.
There are 32 instances of down days which have volatility two standard deviations away from the V20 in the negative side. Out of the 32 instances, 2 instances are from July 2002, 6 instances in second half of 2007, and 19 instances are from September 2008 to April 2009. The extreme negative data also supports the hypothesis that days deviate from the volatility means tend to appear near each other. Out of the 32 instances, 56.2% closed higher than the next day. Once again, the number is really too low be of any significance. However, this finding does confirm with earlier hypothesis that extreme weakness tends to be followed by short term bounce rather than more immediate weakness.
I split data into tow group of V20>2%, and V20>1%, but doing so have not yield much useful data so far.
Wednesday, December 23, 2009
Movement after Extreme Strong and Weak Day

In the previous two posts I talked about average movements after 1, 3, 5, and 10 days after extreme strong and weak days separately. Here is a chart comparing the result from the posts.
In the chart, red bars red bars represents average movement after extreme weak days and green bars represent what happen after strong days.
From the chart, it is very clear that market tends to consolidate immediately after extreme strength, attempts follow through, reverse after follow through, and eventually value being accepted.
However, market tends to bounce back immediately after extreme weakness and slowly giving back the retracement after the immediate bounce.
From the historical data, the best time to enter long position is after an extreme weak day. As the chance of immediate bounce on the day after is nearly 60%. How does this information help me? Seeing weakness following an extreme day, I imagine that knowing the historical tendency would help me placing a trade against the immediate trend to secure good location and ride out the bounce.
Relevant posts:
<What Happens To SPY After Extreme Weak Day>
<What Happens To SPY After Extreme Strong Day>
Tuesday, December 22, 2009
What Happens To SPY After Extreme Weak Day
After looking at what happen after a strong day, let's look at what happen after an extreme weak day.
An extreme weak day in this case is defined as a drop more than -2.28%. From 2000, there have been 58 occurrences such drop took place.
From this simple test, it is very clear that farther weakness is not likely to follow extreme weakness even when stretched out to 10 day move. The observation holds true even in the drop lasted from 6/6/2008 to 4/20/2009. The day after extreme drop has average gain of 0.5% in the period, only when zooming out to 5 days or more the down trend is clear.
An extreme weak day in this case is defined as a drop more than -2.28%. From 2000, there have been 58 occurrences such drop took place.
- Next Day: SPY average 0.57%, 24 (41.38%) down, 34 (58.62%) up. Down day with average of -1.74%, and up day with average of 2.20%.
- 3 Days later: SPY average 0.58%, 26 (44.83%) down, 32 (55.17%) up. Down days with average of -3.16%, and up days with average of 3.62%.
- 5 Days later: SPY average 0.51%, 28 (48.2%) down, 30 (51.72%) up. Down days with average of -4.1%, and up days with average of 4.82%.
- 10 Days later: SPY average 0.42%, 26 (44.83%) down, 32 (55.17%) up. Down days with average of -5.5% and up days with average of 5.23%.
From this simple test, it is very clear that farther weakness is not likely to follow extreme weakness even when stretched out to 10 day move. The observation holds true even in the drop lasted from 6/6/2008 to 4/20/2009. The day after extreme drop has average gain of 0.5% in the period, only when zooming out to 5 days or more the down trend is clear.
Subscribe to:
Posts (Atom)