Tuesday, December 29, 2009

Daily Volatility

ver the flight to Taiwan, I tried looking at the relationship between price and volatility by looking at price, price+1, intraday high minus low, and 20 day moving average of daily volatility using 30 minute intraday data of SPY.

I first check if there’s any follow through on up and down day with daily volatility higher than two standard deviations.

There are 25 instances of up days which have volatility two standard deviation higher than 20 day moving average of volatility (V>V20) out of 2007 days since 2002. Out of 25 instances, 2 instances occurred in January 2007, 5 instances are from July 2002 to October 2002, 12 instances are from September 2008 to February 2009 which coincides with the steepest drop in recent market history. My take on this phenomenon is that once market becomes hectic, the madness will continue for a while. A true longer term bottom will not be put in on a day of huge rally; extreme up days are rare in a market that’s truly going up. On days with high volatility, 52% is followed by up day. The number is really too low to provide any useful information.

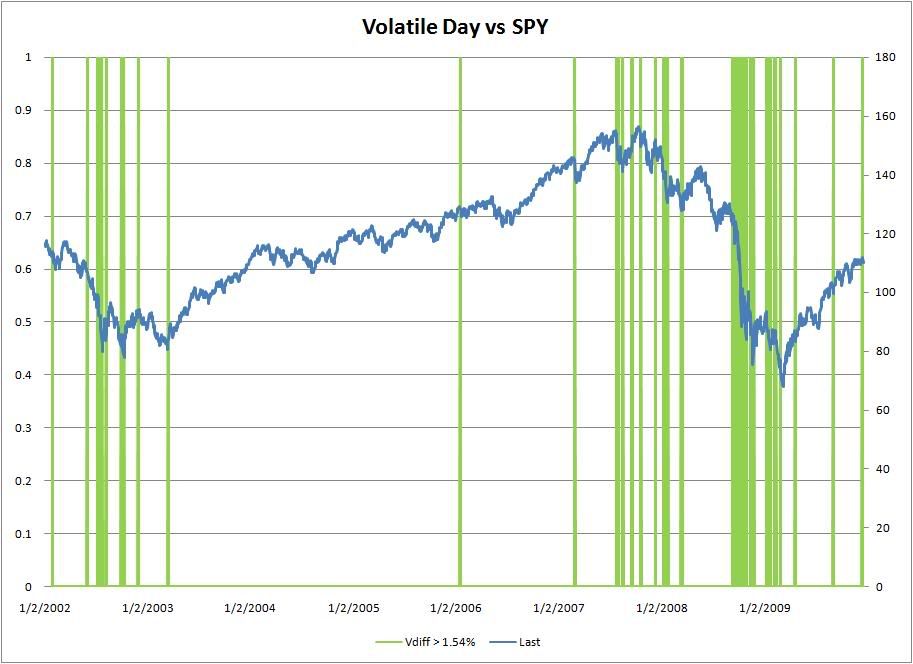
The above chart show volatile up days and SPY daily close price plotted on the same chart. From the chart, it is very clear that in recent market history volatile days (even up days) are associated with weak market.


There are 32 instances of down days which have volatility two standard deviations away from the V20 in the negative side. Out of the 32 instances, 2 instances are from July 2002, 6 instances in second half of 2007, and 19 instances are from September 2008 to April 2009. The extreme negative data also supports the hypothesis that days deviate from the volatility means tend to appear near each other. Out of the 32 instances, 56.2% closed higher than the next day. Once again, the number is really too low be of any significance. However, this finding does confirm with earlier hypothesis that extreme weakness tends to be followed by short term bounce rather than more immediate weakness.

I split data into tow group of V20>2%, and V20>1%, but doing so have not yield much useful data so far.

Wednesday, December 23, 2009

Movement after Extreme Strong and Weak Day


In the previous two posts I talked about average movements after 1, 3, 5, and 10 days after extreme strong and weak days separately. Here is a chart comparing the result from the posts.

In the chart, red bars red bars represents average movement after extreme weak days and green bars represent what happen after strong days.

From the chart, it is very clear that market tends to consolidate immediately after extreme strength, attempts follow through, reverse after follow through, and eventually value being accepted.

However, market tends to bounce back immediately after extreme weakness and slowly giving back the retracement after the immediate bounce.

From the historical data, the best time to enter long position is after an extreme weak day. As the chance of immediate bounce on the day after is nearly 60%. How does this information help me? Seeing weakness following an extreme day, I imagine that knowing the historical tendency would help me placing a trade against the immediate trend to secure good location and ride out the bounce.

Relevant posts:
<What Happens To SPY After Extreme Weak Day>
<What Happens To SPY After Extreme Strong Day>

Tuesday, December 22, 2009

What Happens To SPY After Extreme Weak Day

After looking at what happen after a strong day, let's look at what happen after an extreme weak day.

An extreme weak day in this case is defined as a drop more than -2.28%. From 2000, there have been 58 occurrences such drop took place.

  • Next Day: SPY average 0.57%, 24 (41.38%) down, 34 (58.62%) up. Down day with average of -1.74%, and up day with average of 2.20%.

  • 3 Days later: SPY average 0.58%, 26 (44.83%) down, 32 (55.17%) up. Down days with average of -3.16%, and up days with average of 3.62%.

  • 5 Days later: SPY average 0.51%, 28 (48.2%) down, 30 (51.72%) up. Down days with average of -4.1%, and up days with average of 4.82%.

  • 10 Days later: SPY average 0.42%, 26 (44.83%) down, 32 (55.17%) up. Down days with average of -5.5% and up days with average of 5.23%.

From this simple test, it is very clear that farther weakness is not likely to follow extreme weakness even when stretched out to 10 day move. The observation holds true even in the drop lasted from 6/6/2008 to 4/20/2009. The day after extreme drop has average gain of 0.5% in the period, only when zooming out to 5 days or more the down trend is clear.

Monday, December 21, 2009

What Happen To SPY After Extreme Strong Day

從學習交易以來,我一直把 Dr. Steenbarger 當成是模仿的對象,再來這一系列的文章是以 Dr. Steenbarger <Consecutive Narrow Days: What Comes Nex> 這種文章為範本,來探討 SPY ETF 的特性。

利用 1/2/2002 到 12/18/2009 每日歷史資料 N=2007,我們來看看當 S&P 上漲超過 2.28% 後,再來 1, 3, 5, 10 天的表現。會選擇 2.28% 是因為它剛好是 2 standard deviations from absolute value of daily move,在過去七年來這種情形發生了 50 次:

  • Next Day: SPY average -0.01%,20 (40%) down, 29 (58%) up,1 (2%) flat. Down day with average of -1.67, and up day with average of 1.14%.

  • 3 Days later: SPY average 0.46%, 21 (42%) down, 29 (58%) up. Down days with average of -3.31%, and up days with average of 3.19%.

  • 5 Days later: SPY average -0.4%, 27 (54%) down, 23 (46%) up. Down days with average of -4.2%, and up days with average of 4.06%.

  • 10 Days later: SPY average 0.29%, 21 (42%) down, 29 (58%) up. Down days with average of -5.68% and up days with average of 4.27%.
From the first glance, strength seems to have follow through in the immediate three days after the big move, peters out after stretched out to five days, and gaining back strength after ten days.